
Census 1961 - 1981
Info > Information Pages C-F
1961 Census
Introduction
The census was held on 23 April 1961. There were two versions of the form – a basic version and a 10% sample version with more questions. This was the first census to address some questions to only a sample of the population; the reason for this was to save money. Later it was discovered that the 10% sample had been subject to unconscious bias because enumerators avoided giving the form to older people (Mahon - Short History of Official Data Collection in the UK > page 12)
It was also the first census to use a computer to calculate the results, although the data had to be put on punched cards first to be read in.
The Nomis website has information available for parish and ward. At this time this made no difference as Dartford Rural District wards were co-extensive with the parishes (this did produce unequal representation, Ash and Hartley both had one councillor despite Hartley having nearly 2½ times the population). Parish data was only available for those district councils that paid for the data (see ONS 1961 Census small area statistics).
There had been minor boundary changes since the 1951 census. About 20 properties between the Black Lion and Chapelwood Road on the Ash Road had been transferred from Ash to Hartley parishes. The ONS reckoned this added 43 people to Hartley.
References to Ash parish mean the whole parish of Ash-cum-Ridley which had been created by merger since the 1951 census.
Further Reading:
Population
Hartley and Longfield had seen very significant population growth since 1951. This was down to considerable house building. Longfield had added the St Mary’s Way estate, while Hartley had the new roads of Springcroft and Green Way, together with considerable infilling in roads like Woodland Avenue and Larksfield. Ash’s population had fallen slightly even after the boundary change had been taken into account, but this was all about to change by the 1971 census!
| Parish | Population 1951 | Population 1961 | Change |
| Ash | 1087 | 994 | -93 |
| Hartley | 1255 | 2388 | 1133 |
| Longfield | 1151 | 1807 | 656 |
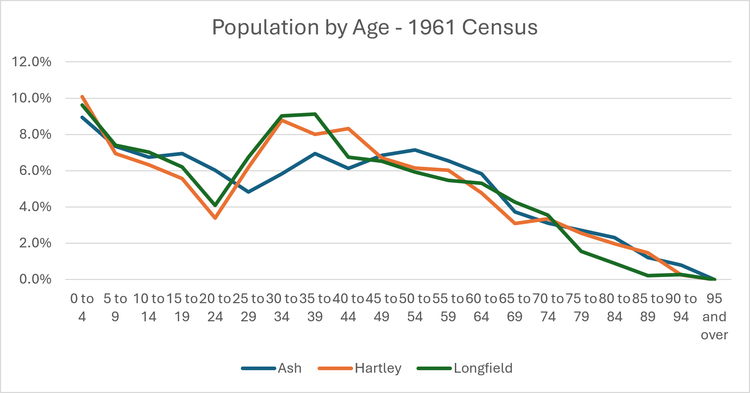
Age
Our area reflected the national trend of a falling birth rate during WW2 with the dip for those born during the war years. It also shows the beginning of the 2nd post war baby boom with a very large number of children aged 0-4.
Further reading: ONS: How is the fertility rate changing in England and Wales?
Sex
Overall 52% of the people living here in 1961 were female and 48% male. However this ranged from 54% female at Hartley to a very slight (50.1%) male majority in Longfield.
As is always the case, the age cohorts with the highest proportion of males are the younger ones, reflecting the fact that slightly more males are born. However there is one striking age group where the proportion of males was at its highest at 53.1%. That is those who were 40-44 in 1961. Again this reflects a known national trend where the proportion of boys being born in 1920 was particularly high.
Further reading: Hannah Fry (for BBC) Why are more boys born in certain years?
Marital Status
Overwhelmingly people were married and married younger than today. Across the three parishes only 9% of adults over the age of 25 had never married. 81% were married (72% for all people in the age bands over 15) and 11% were widowed or divorced. As might be expected there are some striking differences with the results in the 2021 census.
Housing
In 1961 households split 71% owner occupied, 9% council housing and 19% private rented. There was a considerable range across the parishes. Before Wellfield was built Hartley had very low levels of council housing. Meanwhile Ash has more the profile of an agricultural parish, for it had fewer owner occupiers and higher levels of tied accommodation.
| Tenure | Total households | Ash | Hartley | Longfield | Total |
| Owner-Occupiers | 1166 | 54% | 85% | 60% | 71% |
| Renting with Business | 21 | 3% | 0% | 1% | 1% |
| Holding by Employment | 88 | 16% | 2% | 4% | 5% |
| Renting from Council | 141 | 12% | 4% | 12% | 8% |
| Renting Furnished | 22 | 1% | 1% | 1% | 1% |
| Renting Unfurnished | 200 | 12% | 6% | 19% | 12% |
Household Deprivation
The measure of overcrowding was whether there were more people than rooms in the house. By this measure 7% of households were overcrowded which had fallen to 1.7% by 1981. However the modern measure of overcrowding expects more room sharing, so is not directly comparable.
The census also revealed that a significant number of houses still lacked at least one of the basic facilities of piped hot and cold water, fixed bath or indoor WC. Longfield and Ash had a significantly greater proportion of sub-standard housing than Hartley, probably a reflection of the age of the housing stock. By 1981 most houses had these facilities.
Hartley also had 7 households who had to share a kitchen with another household.
The figures below add up to over 100 per cent because some houses lacked more than one item on the list.
| Parish | Ash | Hartley | Longfield | Total |
| Households | 290 | 752 | 593 | 1635 |
| Lack piped cold water | 1% | 0% | 0% | 0% |
| Lack piped hot water | 20% | 3% | 16% | 11% |
| Lack fixed bath | 19% | 3% | 14% | 10% |
| Lack WC | 7% | 1% | 0% | 2% |
| Has all 4 | 77% | 95% | 81% | 86% |
Work
The occupation question was only answered on the 10% sample forms. The Standard Industrial Classification of the time had 24 categories, however the available report on Nomis only gives very broad categories. Production included categories III to XVIII which covered all types of manufacturing. It also included building and construction. Service was categories XIX to XXIV and included public sector jobs, Insurance and Banking, Distributive Trades (Retail, Wholesale), Tranport and other professional services.
As indicated on the household tenure tables above, agriculture was still a very significant industry in Ash but was of less importance to Hartley and Longfield.
Compared with the 2021 census, agriculture has fallen from 6% in 1961 to 2% now, while production has fallen from 37% to 20%, the slack being taken up by the service sector.
| Industry | Ash | Hartley | Longfield | Total |
| Agriculture | 20% | 5% | 1% | 6% |
| Mining | 0% | 0% | 0% | 0% |
| Production | 36% | 38% | 37% | 37% |
| Service | 40% | 53% | 60% | 53% |
| Defence | 2% | 2% | 1% | 1% |
| Sample size | 44 | 93 | 80 | 217 |
Place of Work
Those who filled in the 10% sample form had to give the address of their place of work. The results on Nomis are divided between those who worked in Dartford Rural District and those who worked outside the area. Longfield had a greater proportion working locally. Probably this can be attributed to it being the business centre for the area, including a Dartford RDC works depot in Fawkham Road.
| Parsh | Work away from area | Work in Area | Sample |
| Ash | 72% | 27% | 40 |
| Hartley | 72% | 27% | 92 |
| Longfield | 59% | 40% | 79 |
Social Grade
The 1961 census used 17 social economic groups which roughly correspond to the equivalent ABC classification which is more familiar. Again the figures show up the difference between the more commuter orientated villages of Longfield and Hartley, and the more agricultural Ash, especially the numbers of C1 clerical workers.
| Social Grade | Ash-cum-Ridley | Hartley | Longfield |
| AB | 41% | 31% | 22% |
| C1 | 5% | 26% | 24% |
| C2 | 32% | 29% | 29% |
| DE | 20% | 12% | 24% |
| Total in Sample | 34 | 64 | 58 |
1971 Census
Introduction
The census was held on 26 April 1971. This time there were forms to be completed by the head of the household. If someone objected to giving information to the head they were allowed to complete a form for individuals. The 10% sample introduced in 1961 was continued, but this time this was done at the processing stage to iron out the problems of data quality in 1961.
The small area data has been published by the UK Data Service.
Copyright acknowledgement: This information is licensed under the terms of the Open Government Licence.
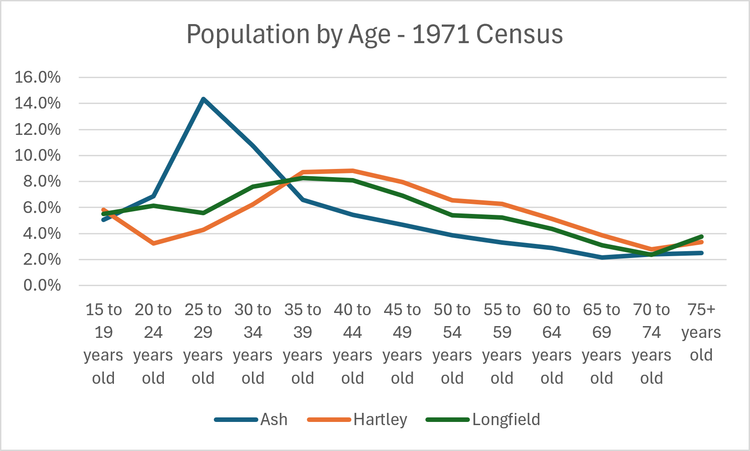
Population
Our area had seen massive change, as the population had increased by over half since the previous census in 1961. The beginnings of New Ash Green had caused the population of Ash to nearly double. Hartley and Longfield, too, had seen a lot of new roads being built and others infilled, for example new roads included Cherry Trees, Round Ash Way and surrounding roads, Northdown Road.
When it comes to the age of residents, 1971 sees the beginning of the "New Ash Green" pattern of having higher numbers of young adults and fewer older people than Hartley and Longfield.
Like 1961 the split between the sexes was 52% to 48% in favour of females. The difference was least in Ash with its younger population. 76% of people over the age of 15 were married, a similar number to 1961, but the single/widowed/divorced is aggregated in the 1971 results, so direct comparison with the 1961 data is not possible.
Population of each parish 1971
Parish | Population 1971 | Population 1961 | Change |
| Ash-cum-Ridley | 1,845 | 994 | +846 |
| Hartley | 3,773 | 2,388 | +1,385 |
| Longfield | 2,318 | 1,807 | +511 |
| Total | 7,931 | 5,189 | +2,742 |
Migration
There had been a lot of new house building since 1961, including the beginnings of New Ash Green, which probably accounted for most of the 298 household increase in Ash parish. This led to a lot of inward migration. The census provided results of a 10% sample of the number of heads of households who had moved here in both the previous year and the previous 5 years, and whether they moved here from within Dartford Rural District, or from further afield. It is not possible to give percentages of movers because the new builds distort the figures and lead to some figures over 100%.
There was also a question about whether someone was born abroad. These numbers had fallen from about 3% of people in 1961 to 1% in 1971, being 83 people. The biggest number being from "Other Europe" (28), being all of Europe except UK, Ireland, Cyprus and Malta.
The census also reported on the number of people who had both parents born outside the UI. Overall 0.3% of people locally had both parents born in the New Commonwealth, which mainly meant India, Pakistan, Sri Lanka and the West Indies. Also 2.4% of people had parents born elsewhere in the world.
Migration to local area in past 1 or 5 years (original figures multiplied by 10 as they were a 10% sample)
Ash | Hartley | Longfield | Total | |||
| Moved within Dartford RDC in last | ||||||
| 1 Year | 0 | 120 | 70 | 190 | ||
| 5 Years | 40 | 510 | 240 | 790 | ||
| Moved from outside Dartford RDC in last | ||||||
| 1 year | 210 | 120 | 150 | 480 | ||
| 5 years | 860 | 1,080 | 470 | 24 | ||
Housing Tenure
Owner occupation rose considerably in the 1960s from 71% in 1961 to 80% in 1971. The rise at Ash and Longfield was particularly marked. Council housing was a little up from 8% to 10%. The tenure to lose out was private renting which fell from 19% in 1961 to 9% in 1971.
Housing Space
In general local houses were spacious. 83% of households had 4-6 rooms, 13% over 7, with only 4% having 3 rooms or less. As might be expected, this meant that most households had fewer people than rooms.
The measure of overcrowding was whether there were more people than rooms in the house. By this measure the number of overcrowded households fell from 7% in 1961 to 2% in 1971. However the modern measure of overcrowding expects more room sharing, so is not directly comparable.
A third of households had plenty of space with less than 0.5 persons per room. In all there was not a great deal of difference in the results between the 3 parishes.
Sub-standard housing
The proportion of houses with substandard facilities declined, but probably the decline is exaggerated by the total number of dwellings having greatly increased. It appears there may have been underreporting of the number of houses without a WC in Longfield in 1961.
Table: Housing Data
Ash | Hartley | Longfield | Total | |
| Tenure | ||||
| Owner occupied | 80% | 87% | 73% | 81% |
| Social Rent | 7% | 9% | 13% | 10% |
| Private Rent | 13% | 4% | 13% | 9% |
| Inhabitants per room | ||||
| Under 1 | 98% | 98% | 97% | 98% |
| Over 1 | 2% | 2% | 3% | 2% |
| Sub-standard accommodation | ||||
| No bath | 4% | 0% | 5% | 2% |
| No inside WC | 4% | 0% | 7% | 3% |
| No hot water | 3% | 0% | 4% | 2% |
Work
All respondents were asked all people over the age of 15 whether they were in employment in the week before the census. If not the alternatives were sick, retired, unemployed and "other". The other category was for housewives, students and the permanently sick. There was a large difference between the number of men and women in employment. Overall 36% of women had jobs but it was 85% of men.
The census has results for type of employment, grade and travel to work. This is based on the 10% sample questionnaire.
Unfortunately the categories of work are different from 1961 but it does appear that the mix of employment locally was broadly the same.
The majority had to commute some distance to work. 29% of workers locally had jobs in the Dartford Rural District, and the other 71% worked further afield. But there were considerable differences between industries. Half of those employed in agriculture and construction worked in the Dartford Rural District, but on the other hand 88% of those employed in manufacturing had to go out of the district for work, probably to Dartford and Gravesend (Dartford Town was outside the Dartford Rural District).
The car was by far the most popular method of travel to work. More than half (55%) went to work by car, but there was a range of 41% in Ash to 64% in Hartley. Overall 19% travelled by train, while smaller numbers used the other methods of transport. People in Ash were the most likely to travel by train.
Table: Employment for those over 15
Ash | Hartley | Longfield | Total | |
| Working | 62% | 58% | 60% | 59% |
| Seeking Work | 2% | 2% | 1% | 1% |
| Sick | 0.1% | 0.2% | 0.2% | 0.2% |
| Retired | 8% | 11% | 10% | 10% |
| Other | 28% | 29% | 29% | 29% |
Living Standards - Car Ownership
This was the first decennial census to introduce the car ownership question. Overall 21% of households in our area had no car rising to a third in Longfield. In 2021 the number of households without a car had fallen to 10%.
For details see 1971 Census Summary Sheet.
Census 1981
Introduction
The 1981 Census was held on 6 April 1981. A copy of the form is available at https://ukdataservice.ac.uk/app/uploads/1981-census-form-england-household.pdf.
As well as producing data for large areas such as local authorities, results are available at council ward level. However this was before a number of significant boundary changes in 1987. In that year the majority of New Barn was added to Longfield parish, while the Longfield – Hartley boundary became the railway line. Further south, four of New Ash Green’s estates were transferred from Hartley to Ash parishes.
Thanks to boundary changes to reflect changing populations, council wards were different in 1981, so exact comparisons are not always possible.
Copyright acknowledgement: Contains ONS data. Contains public sector information licensed under the Open Government Licence v3.0.
Population
The number of households and people very nearly doubled in the period 1971-81. The biggest rise in households was in Ash, which trebled from 588 in 1971 to 1,806 in 1981. By contrast Longfield's number of households was static.
Overall, the population of our area was younger in 1981 than in the previous census. In 1971, 40% of people were under 30 but ten years later this figure had risen to 48%. This had an effect on the gender balance, for males now had a 51-49% majority. Among those aged 0-14 in New Ash Green the proportion was 54-46 in favour of males.
In 1981 three quarters of adults over the age of 16 were married, which rises to 86% for those over 25. All other statuses were aggregated as one Single/Widowed/Divorced category. The figures show that people married at a much younger age then.
The proportion married ranged from 69% (Longfield) to 80% (Ash).
This chart, showing the percentage of people of each 5 year age group shows a remarkable difference between Ash and the other two parishes. New Ash Green has massive spikes for young adults under the age of 40 and children under the age of 10. Otherwise they have fewer of every age category compared with Hartley and Longfield. Over time this trend has flattened out a little but has not wholly disappeared.
And in spite of the opening of Fairby and Old Downs retirement homes, no parish had anyone over the age of 94.

Migration
The 1981 census recorded the numbers of households that had moved to the area in the previous year. Because a lot of development had gone on at the time, the number of new arrivals to the area at 11% is quite a bit higher than the 7% in 2021. As might be expected with the development of New Ash Green, Ash had the highest number of migrants to the area at 15% of all households.
The 1981 census did not directly ask about ethnicity of respondents. However it did ask for country of birth, which found that 92% of local residents were born in England, 4% in the rest of UK and Ireland and 1.5% from the New Commonwealth and Pakistan.
Housing
At 80% owner occupation was very high. This ranged from 74% in Hartley to 89% in Ash. Much of the Wellfield estate in Hartley had been built by then, which boosted the proportion of social housing in Hartley to 23%.
While owner occupation has not changed much since 1981, as a result of government policy, social rent and private rent have changed places. In 1981 owner occupation was 80%, Social Rent 15% and Private Rent 4%.
Respondents were asked to count the number of people in the household and the number of rooms. They were told to exclude bathrooms, WCs, tiny kitchens and rooms for business use.
Average room size was fairly even across the local area at 5.5 rooms per property. While there was an average of 3 people per household. There was not much difference between the 3 wards.
Two person households were the most popular in Longfield and Fawkham & Hartley, while 4 person households was the commonest size in Ash.
Work
As in previous censuses, people's work was aggregated into a few very broad sectors. Unfortunately the ones used in 1981 were not always the same as 1971. Where comparison is possible it shows that agriculture and transport continue their downward trend.
The most popular industry was "Other" with 41%. This would include public sector jobs and service industries such as finance. It was followed by Manufacturing (21%) and Distribution (18%). The distribution sector appears to have had a massive fall in employment since 1971 which makes me think we are not comparing like with like.
Respondents were asked to give the address of their place of work. Back then it was not practical to check every answer, so a 10% sample was undertaken. The report only gives distance travelled to work in a number of bands, which makes it difficult to be certain where people are travelling to. As the distance from Longfield Station to the City of London is just over 30km, it would seem that the majority of those commuting over 30km to work will be going to London. People travelling to Dartford and Gravesend from Hartley and Longfield would probably fall into the 5-9 km band, those doing the same from New Ash Green may also fall into the 10-19 km band. Other places which are 10-19km away include Bexley, Erith, Medway Towns and Sevenoaks.
Living Standards
The figures below were based on a 10% sample of census forms. Compared with 2021 there appears to be a movement from AB to C1 social classes. Hartley and Ash were noticeably more middle class than Longfield in 1981.
- AB (Professional/Managerial) 40% (2021 – 29%)
- C1 (Skilled Clerical) 28% (2021 – 38%)
- C2 (Skilled manual) 20% (2021 – 21%)
- DE (Semi- and unskilled manual, unemployed) 10% (2021 – 12%)
Evidence of improvement in living standards over the previous decade comes from the car ownership question. The number of households with no car fell from 21% in 1971 to 12% in 1981, which is more or less the level it is today. Car ownership increased particularly in Longfield, where the number of no car households fell from 34% in 1971 to 12% in 1981. Since 1981 the number of multiple car owning households has increased significantly.
For more details see 1981 Summary document.