Census 1991
The University of Durham Nomis website has information from the 1991 census down to council ward level. In Hartley's case this was the ward of Fawkham and Hartley. There had been boundary changes since the previous census, Hartley had gained some properties from Longfield, but lost a lot of housing to Ash parish in the northern part of New Ash Green. Council boundary changes since have replaced this ward. Hartley represented over 90% of the population of the ward.
In the pre-digital age, some of these figures are based on a 10% sample of the census returns for Hartley and Fawkham. The headings where this applies have been starred (*).
Population
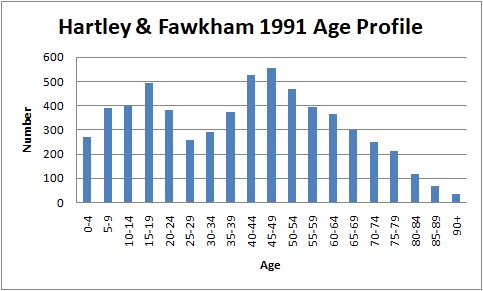
The usually resident population was 6,168 although only 5,889 of them were present in Hartley and Fawkham on census day. This would make the population of Hartley about 5,600.
The familiar dip in the numbers of people living here in their twenties is present, but by 2011 the population had aged considerably.
Ethnicity
This question was not as detailed as the 2011 census. In 1991, 98.5% of people in Hartley & Fawkham were white, 1.2% Asian or Chinese, 0.2% Afro-Caribbean and 0.2% other. The figures have not changed greatly in 2011. 65 people were born in Ireland.
Car ownership*
In 1991 only 15.5% of households had no car, a figure that has since continued to fall. Already 47.4% of households had 2 or more cars.
Housing
Hartley and Fawkham had 2,275 households. Of these 2,047 were houses, and 209 flats with a handful of other categories.
83.2% were owner occupied, 11.9% social rented and 2.2% private rented. In 1991 there was still council housing in Hartley (5.8%). By 2011 the number of private rented houses had doubled at the expense of social rented properties.
789 of the owner occupied houses/flats were owned outright and 1,163 with a mortgage. By 2011 these figures had more or less reversed, probably a result of the older population now.
Just 72 households had moved in the previous year. Of them, 13 had moved from elsewhere in Hartley and Fawkham, 22 from elsewhere in Sevenoaks District, 16 from further afield in Kent. 21 came from further away, including 3 from abroad. Given our proximity to the London region, it is surprising that only 3 households moved here from a UK region outside the south-east. In all 177 people had moved to a new address in the ward.
Employment*
The census divided all jobs into 10 broad classifications. In Hartley and Fawkham the service sectors predominate:
1. Agriculture (1%)
2. Energy and Water (3%)
3. Mining (3%)
4. Manufacturing (8%)
5. Other Manufacturing (7%)
6. Construction (14%)
7. Distribution/Catering (20%)
8. Transport (5%)
9. Banking/Finance (21%)
10. Other services (18%)
The 1991 Census Definitions Booklet (page 67ff) gives more detail of what is contained in each category.
67% of people worked outside Sevenoaks District, 8% worked at home with the remainder working elsewhere in the district (evidence from later censuses would suggest that this was likely to be Hartley and New Ash Green).
Of those who didn't work at home, 15% travelled to work by train, 2% by bus, 72% as a car driver, 6% as a car passenger, 2% by motorbike and 7% on foot.
Health
531 people (8.6%) said they had limiting long term illness. The question said that this might include the problems of old age too, and over half (292) were over 65.
Living Standards*
Based on the traditional social class categories of A-E, 60% were class AB (Managers, Professional), 9% class C1 (Supervisory, clerical and junior managerial/administrative/professional occupations), 20% class C2 (Skilled Manual) and 11% class DE (Semi-skilled or unskilled). The numbers of ABC1 look to be wrong, especially when compared with the 2011 census.