Census 2011
Info > Pages
Introduction
27 March 2011 saw the 20th national census for the UK. Number crunching all those returns takes some time, so the results are being released piecemeal from 2012 onwards.
The census collates the figures for a number of different areas, for Hartley the main ones they use are set out below, but they also cover other areas such as Health Authorities, Parliamentary Constituencies and civil parishes.
Unless otherwise stated, the information set out in the paragraphs below relates to the ward of Hartley and Hodsoll Street.
| Country | England |
| Government Region | South East |
| Local Authority | Sevenoaks |
| Ward | Hartley and Hodsoll Street |
Lower Layer Super Output Areas (see ONS explanation) | 004A - Eastern Hartley bordered by Stack Lane, St Johns Lane, Larksfield and Manor Drive 004B - All of Hartley south of areas 004A and 004C, all of Hodsoll Street and Ridley 004C - Western Hartley north of Fairby Lane and west of Ash Road, also Church Road north of Stack Lane 004D - Wellfield Estate, Quakers Close, Merton Avenue, Hoselands View, Wellfield |
Below the Super Output areas are smaller output areas, a collection of a few roads with a population of about 200 each. The table below is a look up for roads, postcodes and the various output areas. It can be sorted by any column.
Population
Although England's population is rising rapidly, up from 49.1 million in 2001 to 53.0 million in 2011, the population of Hartley and Hodsoll Street slightly fell to 5,835 with the biggest fall in the Wellfield area. The population of New Ash Green and Ash fell significantly over the same period. Both Sevenoaks and Dartford Boroughs have seen increases in population. Sevenoaks is up 5,000 to 114,893. While Dartford, thanks to significant building of houses, has risen from 85,911 in 2001 to 97,365 in 2011.
Of the 5,835 in the ward, there are 2,816 males (48.3%) and 3,019 females (51.7%)
Ward | Households 2011 (2001 in brackets) | Population 2011 (2001 in brackets) | Annual Average No of births 2013-2017 |
| Hartley & Hodsoll Street | 2,405 (+64) | 5,835 (-35) | 39 |
| Hartley Parish | 2,223 (+78) | 5,395 (-36) | |
| 004A East Hartley | 630 (-5) | 1,524 (-20) | 8 |
| 004B S Hartley/Hodsoll St | 596 (+30) | 1,512 (+17) | 10 |
| 004C West Hartley | 654 (+24) | 1,533 (+18) | 6 |
| 004D Wellfield | 525 (+12) | 1,266 (-51) | 15 |
| Ash & New Ash Green | 2,468 (-35) | 6,165 (-430) | 71 |
| Longfield, New Barn, Southfleet | 2,521 (+24) | 6,246 (+79) | 55 |
| Fawkham & West Kingsdown | 2,505 (+44) | 6,062 (+281) | 47 |
Age Profile
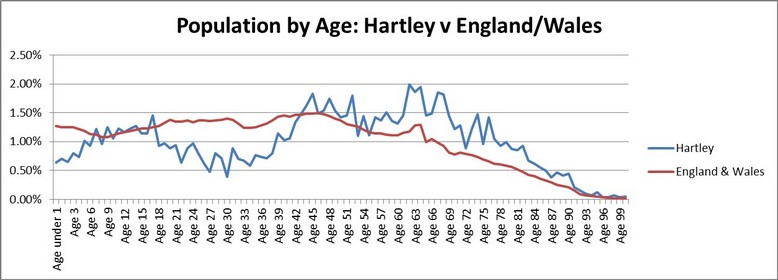
What is striking is the greying of the population in Hartley - the number of people over the age of 60 rose over the ten years from 28% to 35% of all residents, those aged 60-64 are now the largest age group.
The commonest age was 62 with 116 people that age, followed by 64, 63, 67, 45, 68, 52, and 48 (all over 100). In England, reflecting the baby boom of the 1960s, the commonest ages are 46, 45, 44, 47, 42 and 43.
When compared against the country as a whole it is clear that Hartley has a lack of people aged 20-40, no doubt related to a shortage of affordable housing locally. This feeds into the low numbers of children being born in Hartley - the lowest in the area.
Religion
In line with the national trend there has been a significant rise in the numbers of people who say they have no religion. The question is an optional one on the census and these figures do not include the 8% or so who declined to answer.
Religion | 2011 (2001 in brackets) |
| Christianity | 75.4% (85.1%) |
| No religion | 21.9% (13.0%) |
| Hinduism | 1.0% (0.5%) |
| Sikhism | 0.9% (0.5%) |
| Islam | 0.3% (0.2%) |
| Others | 0.2% (0.4%) |
Ethnicity, Language & Identity
Very little change since 2001.
The 2011 did ask a number of other questions. It found 95.1% of people in Hartley and Hodsoll Street were born in the UK (98% of them in England) and 3.9% had been resident for more than 10 years. About half of those not born in the UK had arrived as children.
When it came to national identity within the UK, 72% of people in the ward said they were English only, 10% English and British, and 14% British only. The proportion saying English only is significantly higher than England as a whole (60%). Broken down by age, the young and old were slightly more likely to say they were English, while the middle aged had higher than average British scores. This question was not asked at previous censuses, but it is believed that in the past many more people would have identified themselves as British.
English is the main language of 98.9% of the population aged over 3. 86% of those for whom English is not the mother tongue said they can speak the language well or very well.
Ethnicity | 2011 (2001 in brackets) |
| White British | 93.7% (95.7%) |
| Other white | 2.6% (1.9%) |
| Asian/Chinese | 2.5% (1.8%) |
| Afro-Caribbean | 0.2% (0.1%) |
| Others | 0.3% (n/a) |
| Mixed/multiple ethnic groups | 0.8% (0.5%) |
Housing
The number people owning houses is much higher in Hartley and Hodsoll Street than England as a whole, of the 2,405 households almost half are owned with no mortgage,. Given the age profile of the ward, it is not surprising that a greater proportion are also owned outright.
Owner occupation has risen rapidly over the last century. In 1911 only 14% of houses were owner occupied, this had risen to 65% in 1939 and 75% in 1981. Now it is 83%.
Tenure | Number | Hartley & Hodsoll Street | England |
Owned - no mortgage | 1,199 | 49.9% | 30.6% |
Owned - with mortgage | 809 | 33.6% | 32.8% |
Shared Ownership | 29 | 1.2% | 0.8% |
Social Rented | 213 | 8.8% | 17.7% |
Private Rented | 115 | 4.8% | 16.8% |
Living Rent Free | 40 | 1.7% | 1.3% |
People in Hartley and Hodsoll Street do not move much. The census asked people to say whether they had moved within the last year. Only 98 (4.1%) of households moved completely, in addition 66 households "partially" moved, this means that some of their members moved away but others remained the same. The owner occupied figures include the 29 shared owners, the private rented figure includes the rent free properties.
Type | All households | Owner occupiers | Social Rented | Private Rented |
Total Households | 2,405 | 2,037 | 213 | 155 |
Lived in ward 1 year ago | 2,307 | 1,981 | 201 | 125 |
Moved from elsewhere within ward | 14 | 8 | 0 | 6 |
Moved from within Sevenoaks district | 18 | 7 | 8 | 3 |
Moved from elsewhere in UK | 61 | 39 | 4 | 18 |
Moved from abroad | 5 | 2 | 0 | 3 |
Households wholly moving | 4.1% | 2.7% | 5.6% | 19.4% |
Partially moving household | 66 | 56 | 5 | 5 |
Employment
Under the influence of Bluewater, shop work is the main profession locally, followed by construction and human health. Once the largest employer in the c19th, now only 16 people are employed in agriculture.
The figures relate to the 2,664 people aged between 16 and 74 in employment, the figures are further broken down by the 1,430 men and 1,234 women. They show there are still considerable differences between the sexes when it comes to employment sectors. For men the biggest employer is construction, while for women it is health and social work.
Of the 2,664 in employment, 68% work full time (over 30 hours) and 32% part time.
Employment by sector - Hartley & Hodsoll Street 2011 | Number | Percent | Men | Women |
| Wholesale
and retail trade | 412 | 15.5% | 13.9% | 17.3% |
| Construction | 350 | 13.1% | 19.7% | 5.5% |
| Human health and social work | 302 | 11.3% | 5.2% | 18.5% |
| Education | 225 | 8.4% | 3.3% | 14.4% |
| Professional, scientific and technical | 211 | 7.9% | 8.0% | 7.9% |
| Financial and insurance | 203 | 7.6% | 9.3% | 5.7% |
| Manufacturing | 181 | 6.8% | 8.7% | 4.6% |
| Public Administration and defence | 144 | 5.4% | 5.5% | 5.3% |
| Administrative and support service activities | 125 | 4.7% | 5.2% | 4.1% |
| Information and communication | 115 | 4.3% | 6.3% | 2.0% |
| Transport and storage | 95 | 3.6% | 5.2% | 1.5% |
| Accommodation and food service activities | 70 | 2.6% | 2.3% | 3.0% |
| Real Estate | 45 | 1.7% | 1.5% | 1.9% |
| Utilities | 30 | 1.2% | 1.7% | 0.4% |
| Agriculture and forestry | 16 | 0.6% | 0.6% | 0.6% |
| Mining and quarrying | 2 | 0.1% | 0.1% | 0.1% |
| All others | 138 | 5.2% | 3.5% | 7.1% |
Place of work
The Office for National Statistics has just released another batch of figures from the 2011 census. This is the results of the question where people worked. The figures are not yet available for parish or council ward, the smallest area available are "Middle Layer Super Output Areas". Fortunately for us Hartley and Hodsoll Street council ward is co-terminous with Sevenoaks 004 MSOA.
The figures show that 375 work at home, 269 have no fixed place of work, while 2,028 commute. By far the most important is North Kent, with nearly 600 commuting to Dartford, Bexley and Gravesend. Local employment in Hartley, Longfield, New Ash Green and Fawkham is about 350. While about 200 work in central London, well ahead of its new rival Canary Wharf. In contrast, the numbers working in the remainder of Sevenoaks District is relatively low.
The figures can be further broken down by Age and Method of Travel. I have included the latter here. They show the overwhelming popularity of the car for travel to work, even for locations where a public transport option is available (e.g. Bluewater). 58% of those who work in Hartley take the car too. The car statistics include a small number of people who use motorbikes or are car passengers.
The census also records 679 people who live elsewhere but work in Hartley and Hodsoll Street, by far the biggest number (122) come from New Ash Green.
Place | Number | Car | Train | Bus | Walk/Cycle |
| Dartford | 185 | 97% | 0% | 2% | 1% |
Bexley Borough (Crayford 43, Bexleyheath 21, Erith 19, Foots Cray 19) | 156 | 96% | 1% | 1% | 0% |
| Gravesend and Northfleet | 129 | 95% | 0% | 4% | 1% |
| Hartley | 128 | 59% | 2% | 0% | 38% |
| Longfield | 114 | 71% | 2% | 1% | 25% |
| Bluewater | 113 | 89% | 2% | 7% | 2% |
| City of London | 103 | 14% | 71% | 16% | 0% |
| Westminster Borough | 92 | 5% | 88% | 7% | 0% |
Bromley Borough (Bromley 25,Orpington 24, St Mary Cray 11, Beckenham 10) | 82 | 72% | 24% | 4% | 0% |
| Medway Towns | 62 | 94% | 5% | 2% | 0% |
| Fawkham / West Kingsdown | 60 | 90% | 0% | 0% | 8% |
| Greenwich Borough | 60 | 93% | 7% | 0% | 0% |
| New Ash Green | 49 | 84% | 0% | 2% | 14% |
| Borough Green / King's Hill / West Malling | 49 | 100% | 0% | 0% | 0% |
Sevenoaks (incl Dunton Green, Kemsing, Riverhead, Shoreham) | 46 | 91% | 7% | 0% | 2% |
Swanley (incl Crockenhill, Eynsford, Hextable, South Darenth) | 40 | 85% | 10% | 0% | 5% |
| Southwark Borough | 37 | 41% | 51% | 8% | 0% |
| Canary Wharf | 34 | 24% | 38% | 38% | 0% |
| All other UK | 499 | ||||
| No fixed place of work | 269 | 84% | 10% | 1% | 2% |
| Abroad | 3 | ||||
| Work from home | 375 |
Health
95% describe their health as "fair", "good" or "very good". 224 people (3.8%) describe it as "bad" and 54 people (0.9%) describe it as "very bad".
697 people (11.9%) provide at least 1 hour of unpaid care every week. Of those 113 are providing 50 hours or more per week.
Living Standards
Using the traditional ABCDE social classes, 31% of Hartley and Hodsoll Street are class AB (Managers, Professional), 35% are C1 (Supervisory, clerical and junior managerial/administrative/professional occupations), 21% are C2 (Skilled Manual) and 14% are DE (Semi-skilled or unskilled).
The vast majority of people (90%) living in Hartley and Hodsoll Street have passports and so presumably take part in foreign travel (among those aged 16 to 64 passport ownership rises to 95%). Only 1% of households now do not have central heating at all, gas accounts for three quarters of all central heating systems. The high level of car ownership has been mentioned above.
The census uses a measure called "occupancy rating" to tell whether a house is overcrowded. A minus figure indicates overcrowding. In Hartley and Hodsoll Street only 2.7% of houses have a minus occupancy rating, compared with 8.7% for England as a whole.